Complete GUI Workflow
In this tutorial, we will use the components of the four point probe measurement which we implemented in the previous tutorials and put it to the test by running a complete workflow in the graphical user interfaces.
Environment
Important
In order to work with the graphical user interfaces, you will need the gui extra. If you installed only the core
package, run the following command to get all required dependencies:
pip install cohesivm[gui]
We will be working in Jupyter and need to put together the implemented components (Device,
Interface, and Measurement) in
fpp_components.py, the Analysis in
fpp_analysis.py, as well as the mimetic fpp_connect.py module.
Here is the recommended test folder structure:
src
 ├── fpp_analysis.py
 ├── fpp_components.py
 ├── fpp_connect.py
 └── workflow.ipynb
Run the Experiment
Following the procedure given in Experiment GUI, we initialize the experiment and a
DataStreamPlot which are injected into the ExperimentGUI.
from cohesivm.database import Database
from cohesivm.experiment import Experiment
from cohesivm.gui import XYDataStreamPlot ExperimentGUI
from fpp_components import CurrentSourceChannel, VoltmeterChannel, FPPDevice, FPP2X2, FPPMeasurement
db = Database('workflow.h5')
current_source = CurrentSourceChannel(max_voltage=5.)
voltmeter = VoltmeterChannel()
device = FPPDevice('4')
interface = FPP2X2('5')
measurement = FPPMeasurement(
currents=[1e-6, 1e-5, 1e-4, 5e-4, 1e-3, 3.3e-3, 6.7e-3, 1e-2],
temperature=300,
film_thickness=2e-4
)
experiment = Experiment(
database=db,
device=device,
interface=interface,
measurement=measurement,
sample_id='fpp_test',
selected_contacts=None
)
plot = XYDataStreamPlot('Current (A)', 'Voltage (V)')
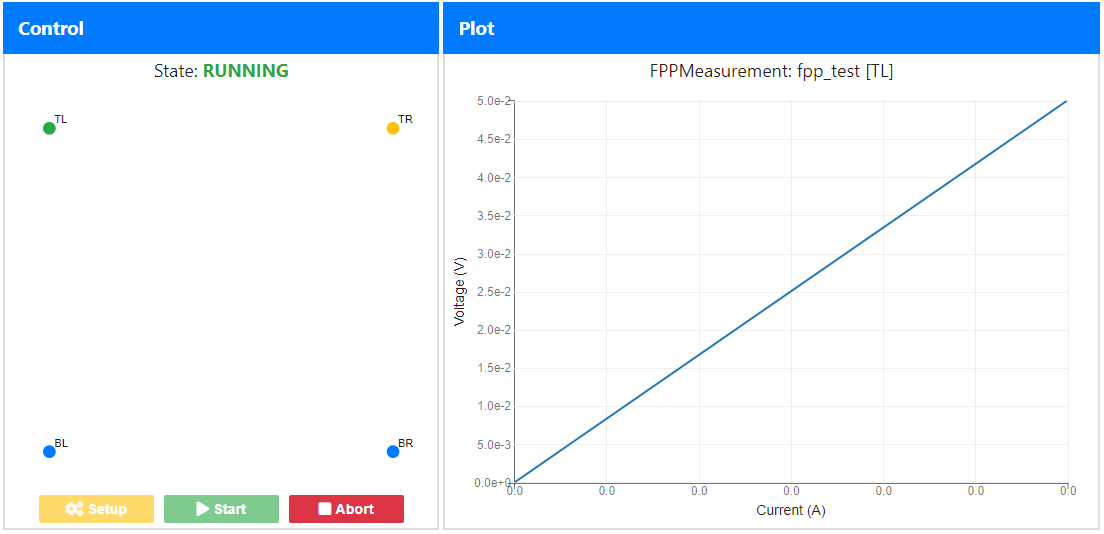
ExperimentGUI(experiment=experiment, plot=plot).display()
This will display the following Graphical User Interface which we can use to run and observe the experiment by clicking Setup and Start.
Locate the Dataset
Now, an additional file has been created in the project folder:
src
 ├── fpp_analysis.py
 ├── fpp_components.py
 ├── fpp_connect.py
 ├── workflow.h5
 └── workflow.ipynb
This HDF5 file stores the measurement data alongside the metadata which was automatically collected. We can display its
contents using the DatabaseGUI.
from cohesivm.database import Database
from cohesivm.gui import DatabaseGUI

db = Database('workflow.h5')

DatabaseGUI(db).display()
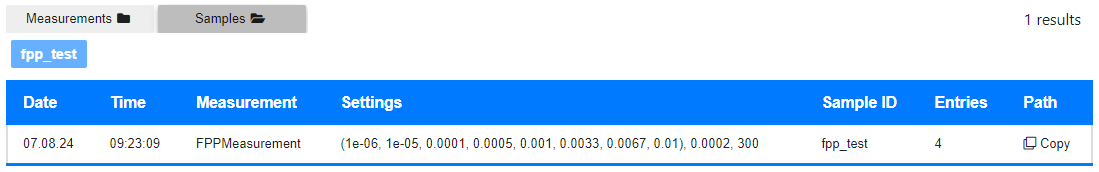
There, we locate the measurement in the Sample folder and copy the dataset path by clicking on the Copy button:
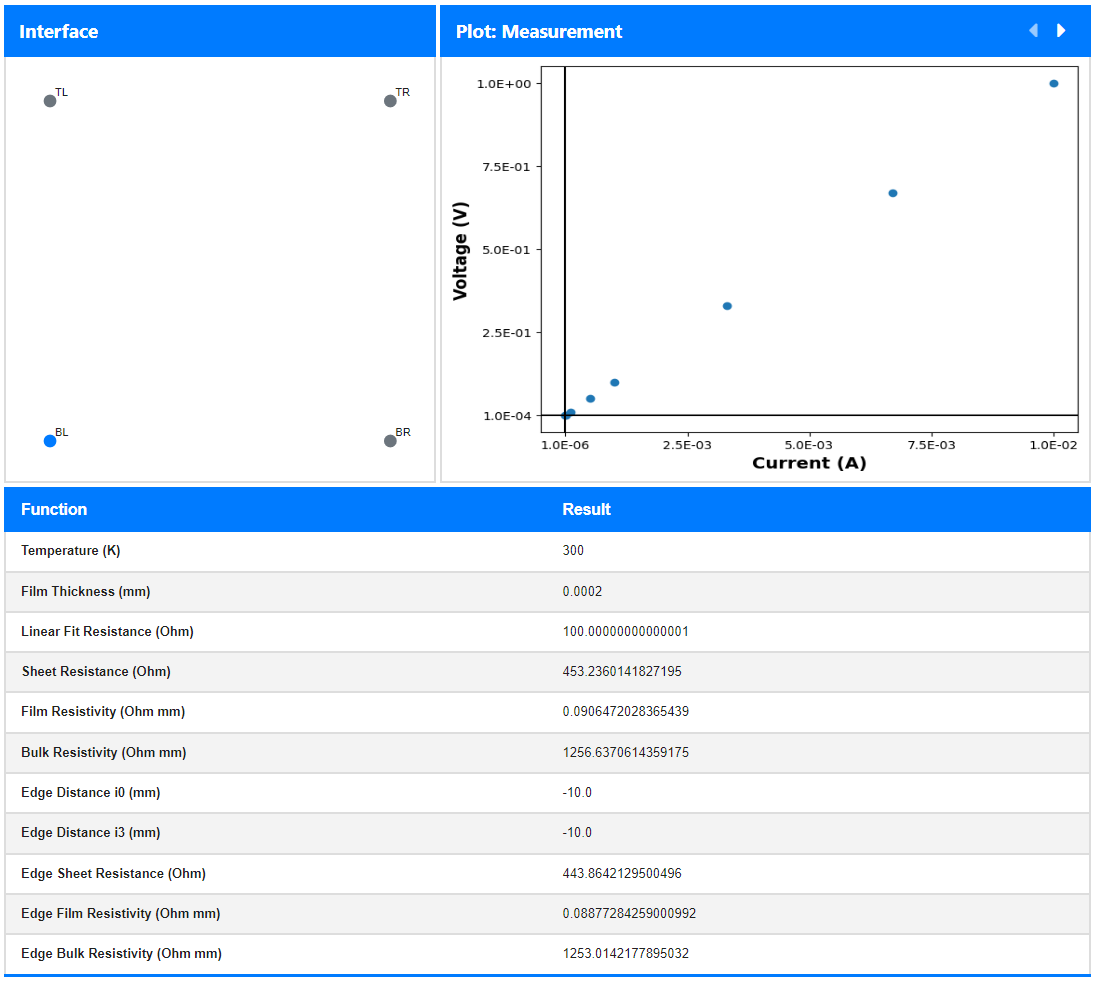
Check the Results
After loading the dataset using the path sting from before, we initialize and display the
AnalysisGUI, to get an overview of the data and analysis results.
from cohesivm.database import Database
from cohesivm.gui import AnalysisGUI
from fpp_analysis import FPPAnalysis

db = Database('workflow.h5')

dataset = db.load_dataset(
    # input your copied dataset path
)

analysis = FPPAnalysis(dataset)

AnalysisGUI(analysis).display()
After clicking on one of the contacts in the left panel, the results from the plots
and functions will appear on the right and bottom, respectively.