Database GUI
This Graphical User Interface enables to display and filter the contents of a database file.
Environment
Important
In order to work with the graphical user interfaces, you will need the gui extra. If you installed only the core
package, run the following command to get all required dependencies:
pip install cohesivm[gui]
We use the code from the test of the DatabaseGUI for demonstrating its functionality:
import cohesivm

db = cohesivm.database.Database('test_database_gui.h5')

for i in range(5):
    metadata_dict1 = {
        'measurement': 'TestMeasurement',
        'measurement_settings': {'setting_same': 0, 'setting_int': i+1, 'setting_float': i*3.14, 'setting_bool': True, 'setting_tuple': (1, i)},
        'sample_id': 'test_sample',
        'device': 'TestDevice',
        'channels': ['TestChannel1', 'TestChannel2'],
        'channels_settings': [{'test': 1, 'test_b': 2}, {'test': 2, 'test_b': (3, 4)}],
        'interface': 'TestInterface',
        'interface_dimensions': str(database.Dimensions.Point()),
        'contact_ids': ['0'],
        'contact_positions': [(0, 0)],
        'pixel_dimensions': [str(database.Dimensions.Point())]
    }
    metadata_dict2 = metadata_dict1.copy()
    metadata_dict2['measurement_settings'] = {'setting_same': 0, 'setting_int': i+2, 'setting_float': i*2.72, 'setting_bool': True, 'setting_tuple': (3, i)}
    metadata_dict3 = metadata_dict1.copy()
    metadata_dict3['measurement_settings'] = {'setting_same': 0, 'setting_int': i+3, 'setting_float': i*1.62, 'setting_bool': False, 'setting_tuple': (1, i, 3, 4)}
    metadata_dict4 = metadata_dict1.copy()
    metadata_dict4['measurement'] = f'Measurement{i}'
    metadata_dict5 = metadata_dict1.copy()
    metadata_dict5['sample_id'] = f'sample_{i}'
    for metadata_dict in [metadata_dict1, metadata_dict2, metadata_dict3, metadata_dict4, metadata_dict5]:
        metadata = cohesivm.database.Metadata(**metadata_dict)
        db.initialize_dataset(metadata)

database_gui = cohesivm.gui.DatabaseGUI(db)
database_gui.display()
After initializing a Database, all we are doing here, is to create and modify some
Metadata objects. Most importantly, we use different
measurement_settings because the data can be filtered based on them. By calling
initialize_dataset(), we create an (empty) entry in the database which we can search
for.
Usage
After running this code in a Jupyter Notebook, you should see two buttons: Measurements and Samples. If you click on the former one and select the TestMeasurement, the GUI should look like this:
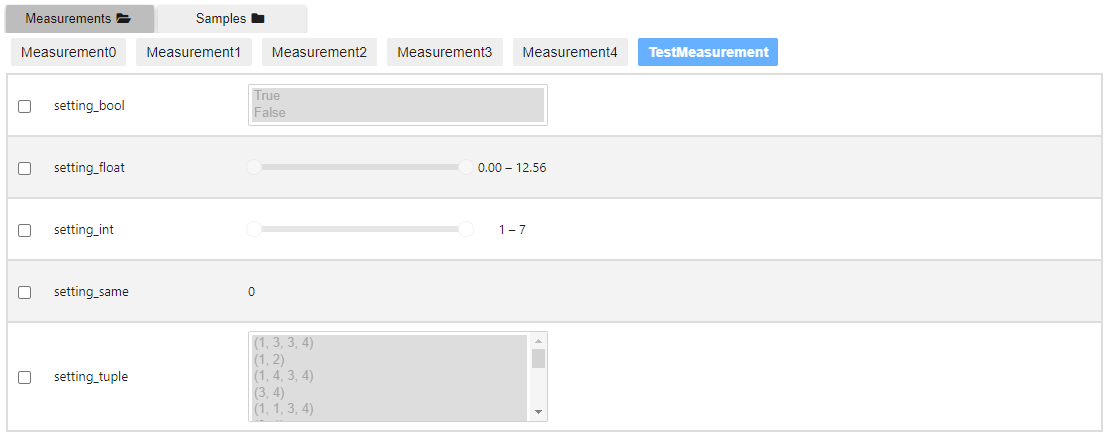
The displayed list corresponds to the measurement_settings and you can filter using
the checkboxes, value sliders, and selection boxes which depend on the datatypes of the settings. Afterwards, the
number of results is displayed in the top right and the dataset entries are listed below the filters:
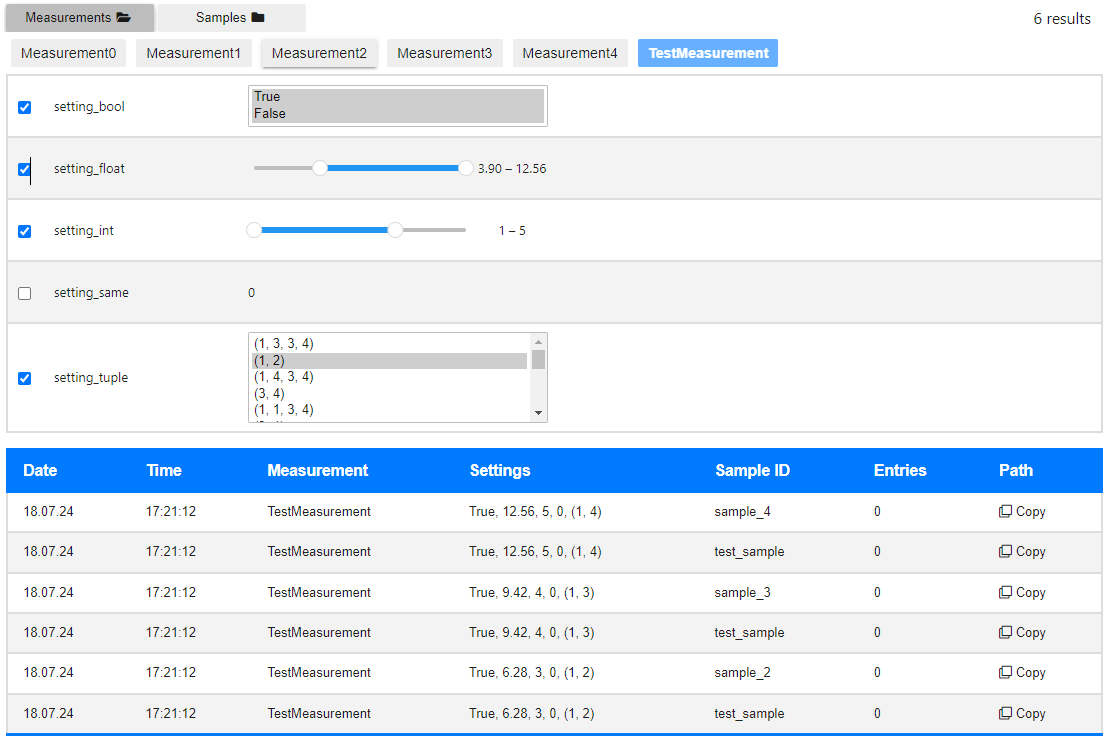
The table provides some information about the datasets, including the Settings which correspond to the filters above.
Hitting the Copy button in the last column Path will put the dataset path into the clipboard, to facilitate loading
a dataset (load_dataset()).
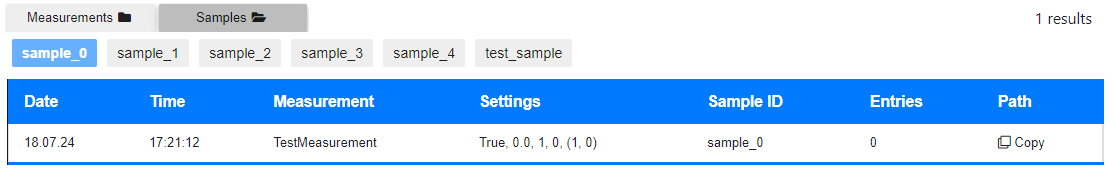
As expected, clicking on the Samples button will display all available sample IDs. Selecting one of these results in a list of dataset entries which correspond to this sample_id: