Experiment GUI
This Graphical User Interface enables to monitor and control an experiment.
Environment
Important
In order to work with the graphical user interfaces, you will need the gui extra. If you installed only the core
package, run the following command to get all required dependencies:
pip install cohesivm[gui]
We use the code from the test of the ExperimentGUI for demonstrating its functionality:
import cohesivm
import multiprocessing
import numpy as np


class DemoDevice(cohesivm.devices.Device):
    def __init__(self) -> None:
        cohesivm.devices.Device.__init__(self, [None])

    def _establish_connection(self) -> None:
        pass


class DemoInterface(cohesivm.interfaces.Interface):
    _interface_type = cohesivm.interfaces.InterfaceType.Demo1
    _interface_dimensions = cohesivm.database.Dimensions.Point()
    _contact_ids = ['11', '12', '21', '22']
    _contact_positions = {contact: position for contact, position in zip(_contact_ids, [(0, 1), (1, 1), (0, 0), (1, 0)])}

    def __init__(self) -> None:
        cohesivm.interfaces.Interface.__init__(self, cohesivm.database.Dimensions.Point())

    def _select_contact(self, contact: str) -> None:
        pass


class DemoMeasurement(cohesivm.measurements.Measurement):
        _name = 'demo'
        _interface_type = cohesivm.interfaces.InterfaceType.Demo1
        _required_channels = []
        _output_type = np.dtype([('x', float), ('y', float)])

        def __init__(self) -> None:
            cohesivm.measurements.Measurement.__init__(self, {}, (10, 2))

        def run(self, device: cohesivm.devices.Device, data_stream: multiprocessing.Queue) -> np.ndarray:
            results = []
            for i in range(10):
                result = (i, i*i)
                data_stream.put(result)
                results.append(result)
                time.sleep(1)
            return np.array(results)


db = cohesivm.database.Database('test_experiment_gui.h5')
interface = DemoInterface()
measurement = DemoMeasurement()
device = DemoDevice()

experiment = cohesivm.experiment.Experiment(
    database=db,
    device=device,
    measurement=measurement,
    interface=interface,
    sample_id='test',
    selected_contacts=['11', '12', '22']
)

plot = cohesivm.gui.XYDataStreamPlot('a', 'b')

experiment_gui = cohesivm.gui.ExperimentGUI(experiment=experiment, plot=plot)
experiment_gui.display()
Firstly, we implement the required components for running an Experiment:
The
Deviceshould not do anything, so we can just define empty methods.In the
Interface, we need to implement thecontact_positionswhich determines how the Control section of theExperimentGUIwill look like.Since we want to simulate how the data from a
Measurementwould be visualized, we should define arun()that sequentially puts data into thedata_stream.
Then, we initialize the components and the Experiment with the only notable detail that
the selected_contacts are only three out of the four which we defined in the DemoInterface.
Usage
As a result of running the code above in a Jupyter Notebook, the following GUI should be displayed:
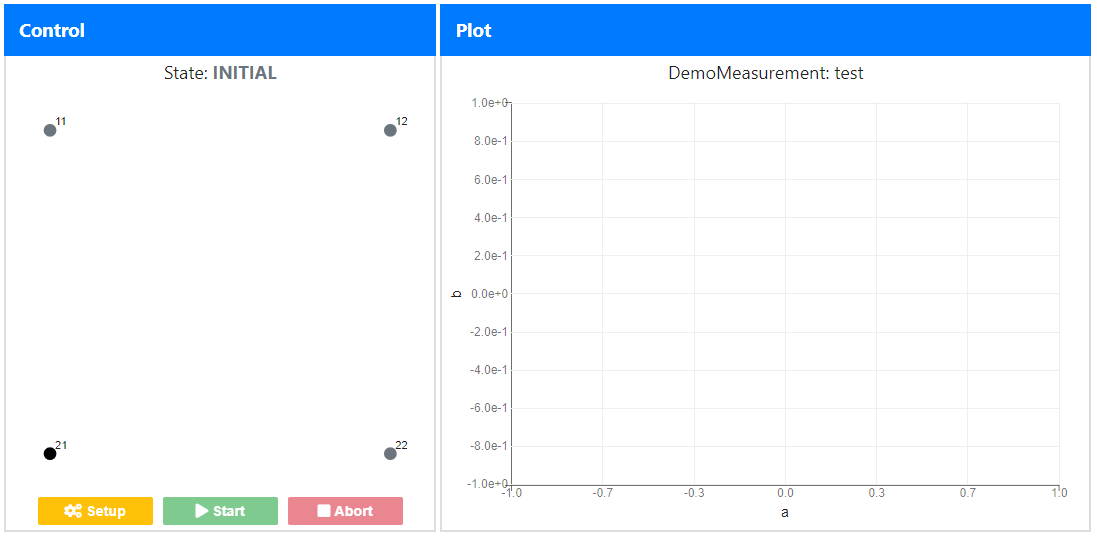
On the left panel “Control”, you see the current ExperimentState, followed by a
representation of the Interface and the control buttons at the bottom.
The dots, which represent the individual contacts with their respective
contact_ids, are colored according to their current state (in this case gray
for INITIAL). The black dot is the contact which was left out when the selected_contacts was defined above.
If you click on a dot, a preview measurement will run which actually performs the measurement but does not store any
data. This way, you can check if you chose the correct measurement settings:

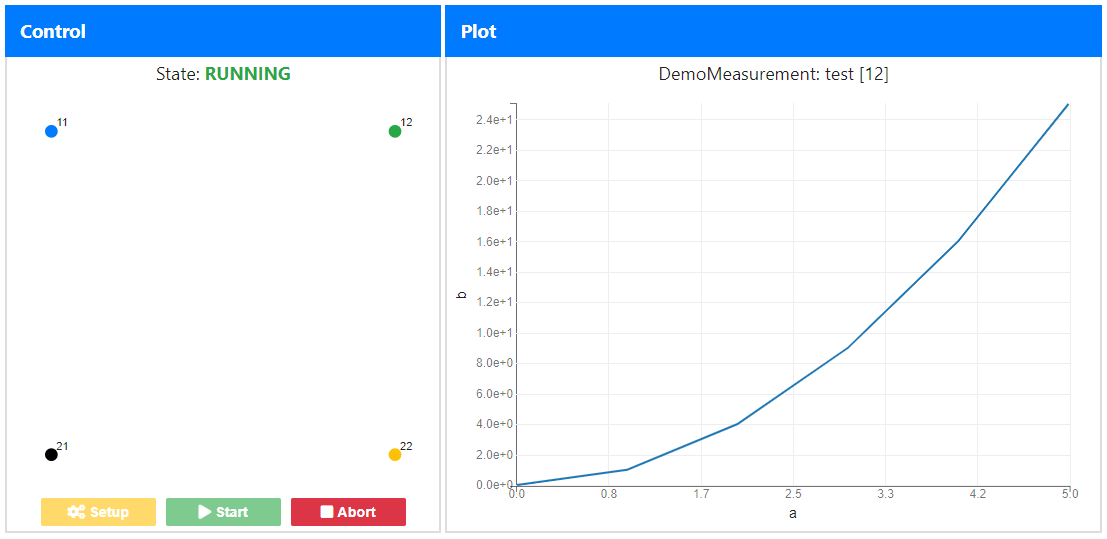
As you can see, the state in the “Control” panel changed to RUNNING and the dot you clicked on turned green. On the
right “Plot” panel you can see the current results and the plot gets updated as new data arrives. In this case, the
graph is a simple x-y-plot (XYDataStreamPlot) as defined in the example code but more complex
ones may also be implemented, following the DataStreamPlot abstract base class. The title of
the plot provides the specific information that you are running a preview() and
states the ID of the currently selected contact.
Now, if you are satisfied with the measurement settings and the selection of contacts, you simply Setup the
experiment and hit Start. The former button click will turn the dots yellow and create a dataset entry. This can be
deleted by clicking the Abort button which may also be clicked during a measurement to cancel an experiment. Finally,
FINISHED measurements will be indicated by blue dots: